
Case studies · Hardware Bench
Closing the loop on real hardware
Four client engagements where a Hapimatic session looked at a physical device, measured it, found the cause, changed something, and measured again
Client, product, and person names are withheld, and parts are named by their role. A number is measured on the bench unless it says projected. Photos are lab-camera frames and captures from the engagements, cropped or blurred where they showed a name, a logo, a serial, or a label.
The four studies
- 01 · Lab instrumentThe instrument that would not rechargeA fleet-wide charge fault traced to the charger's programmed current
- 02 · Energy-harvesting glassThe demo that looked brokenA readout swinging 130 to 990 mW, steadied to ±4 %
- 03 · Audio deviceThe device that slept at 138 mADeep-sleep firmware on a new microcontroller: 138 mA to 1.2 mA
- 04 · Livestock wearableThe fuel gauge that said one dayA gauge register 100× off: about a day became 17 days in the field
The same loop, every time
Each study ran the same six steps on real hardware, not a simulation. The loop, not the code generation, is the point.
- 01ObserveA camera on the bench, a shell on the running device, live instrument readings.
- 02HypothesizeFrom the netlist, the datasheets, and the device's own source code.
- 03MeasureElectronic load, oscilloscope, power profiler, energy meter, and panel meters read through the camera.
- 04DiagnoseMechanism first: the electrical why, not only the symptom.
- 05VerifyMeasure again after the change, to prove the fix rather than assume it.
- 06RecordWrite the finding to a durable knowledge base with its source and a confidence tier.
Who does what
The session observes, measures, diagnoses, and writes the record. A person does the physical rework: the soldering, the part swap, the probe on the pin.
Every claim in a study traces to a source: a tool call, a commit, or a measurement. Where a figure is projected rather than measured, it says so.
When a better measurement disagreed with the session's own earlier estimate, the estimate was replaced and the correction recorded.
01 · A field-deployed, battery-powered lab instrument
The instrument that would not recharge
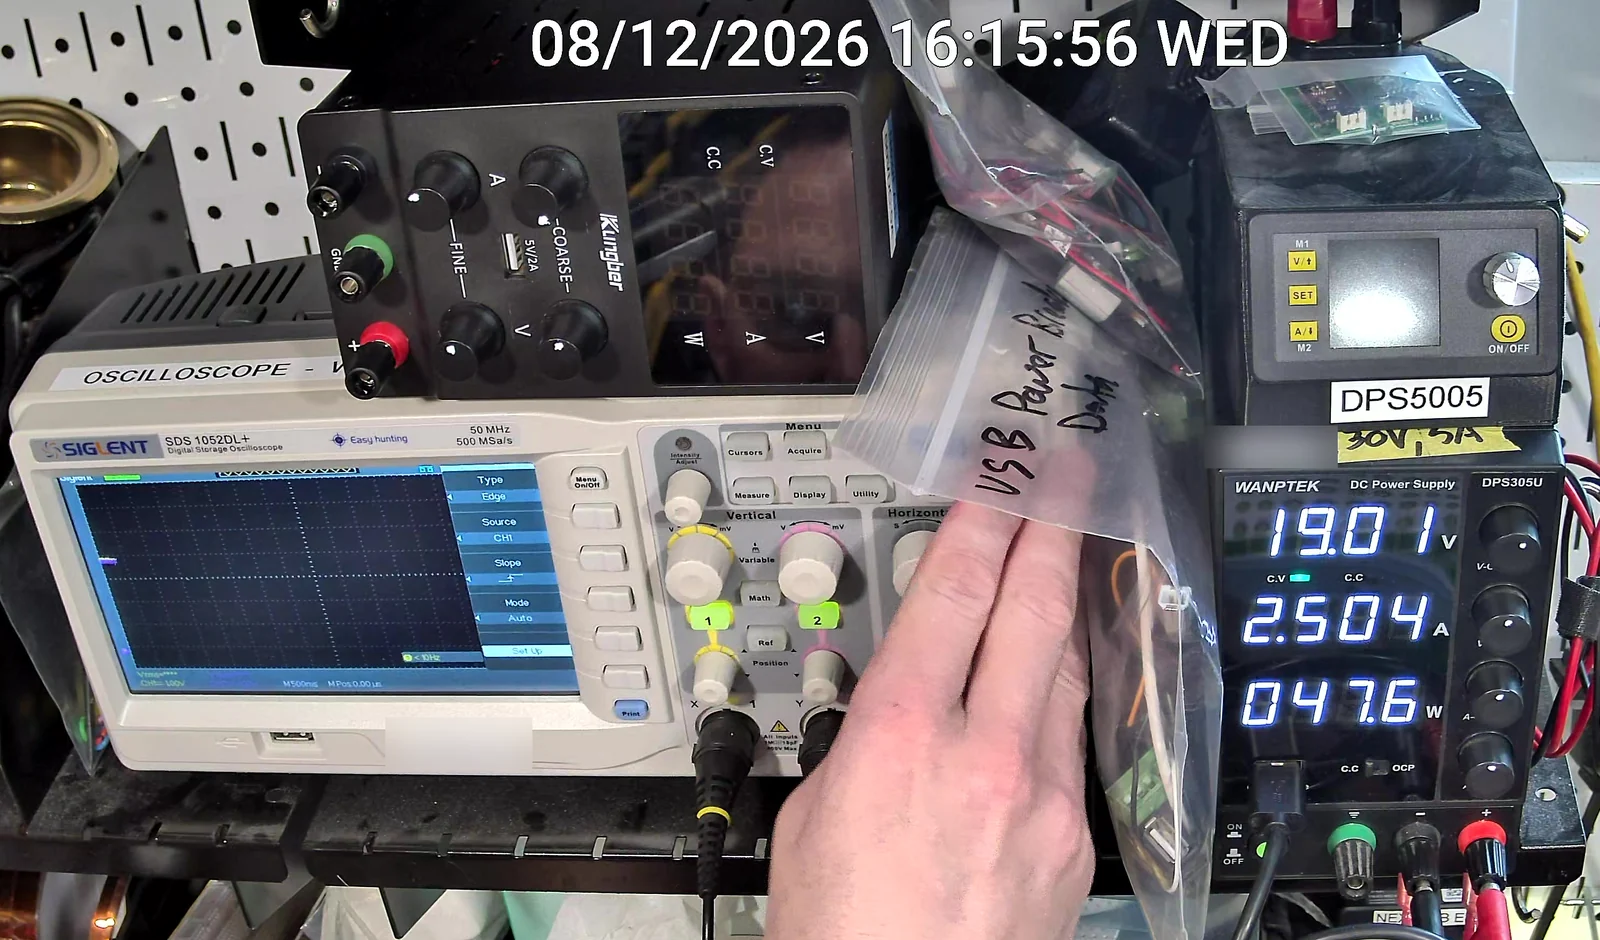
An inherited device with no documentation, design files that did not match the board that shipped, and a fleet in the field reporting the same fault: after a day's use it would not recharge. It also ran warm while charging and sometimes shut itself down.
Swipe sideways to see the whole figure
From the bench
What the session did
- Rebuilt the power tree from the real netlist and confirmed a real-time-clock wiring defect with an electrical rule check: exactly two dangling labels.
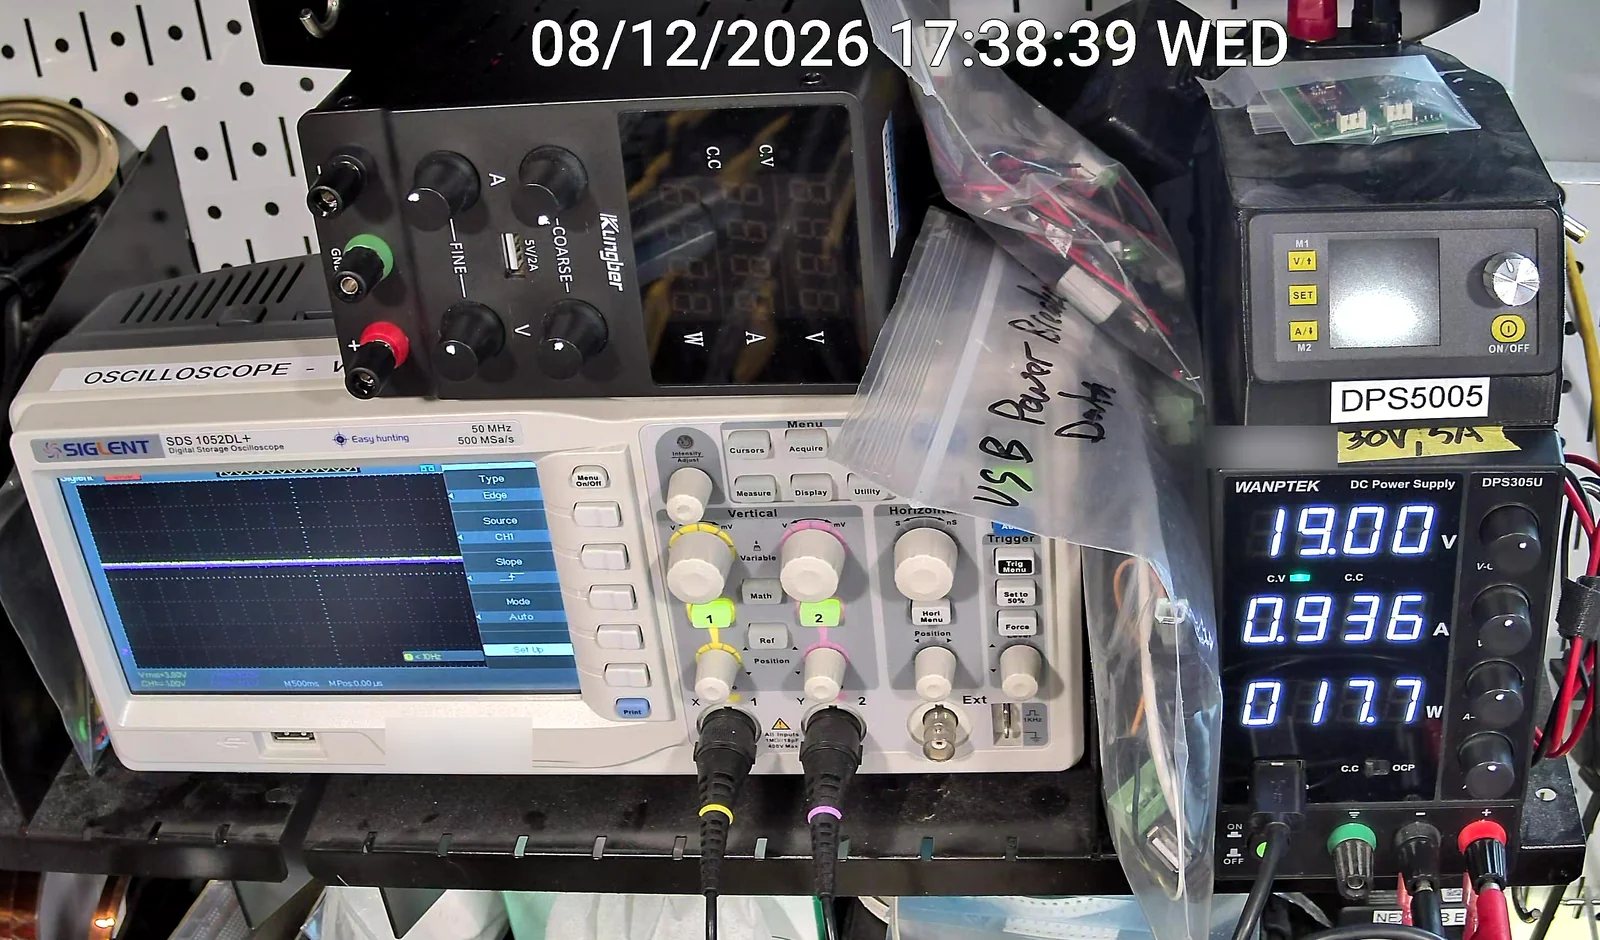
- Traced the charge path to the charger's programmed current, which sat at the battery pack's own protection limit, a design-margin fault across the whole fleet. Reproduced the trip on the bench and validated a one-resistor fix.
- Found a software power-off that left the board drawing current with a dead button, and a 90-second shutdown hang, and fixed both.
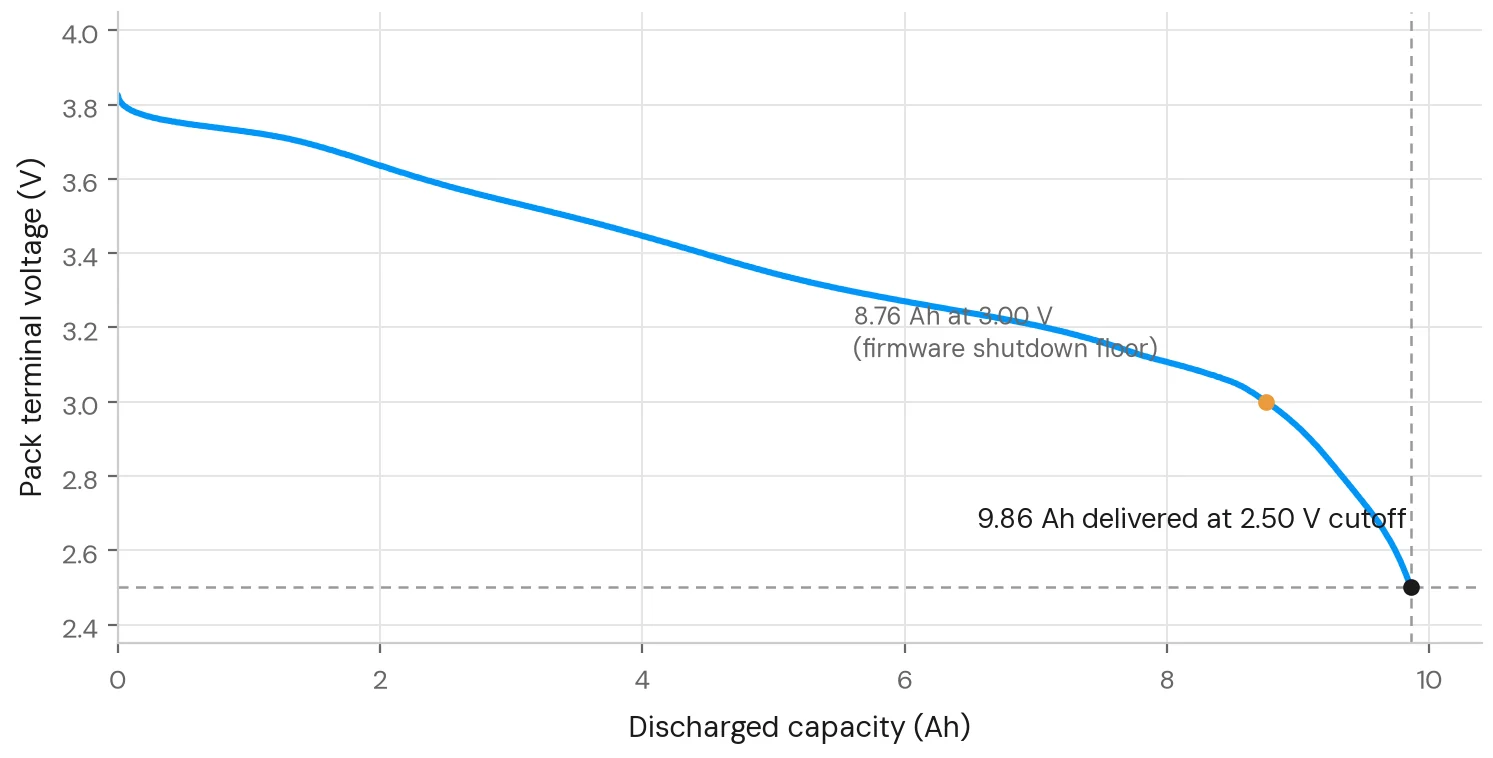
- Wrote and hardware-validated its own driver for the bench electronic load, measured the pack's true capacity, and reconciled the on-board fuel gauge against that reference.
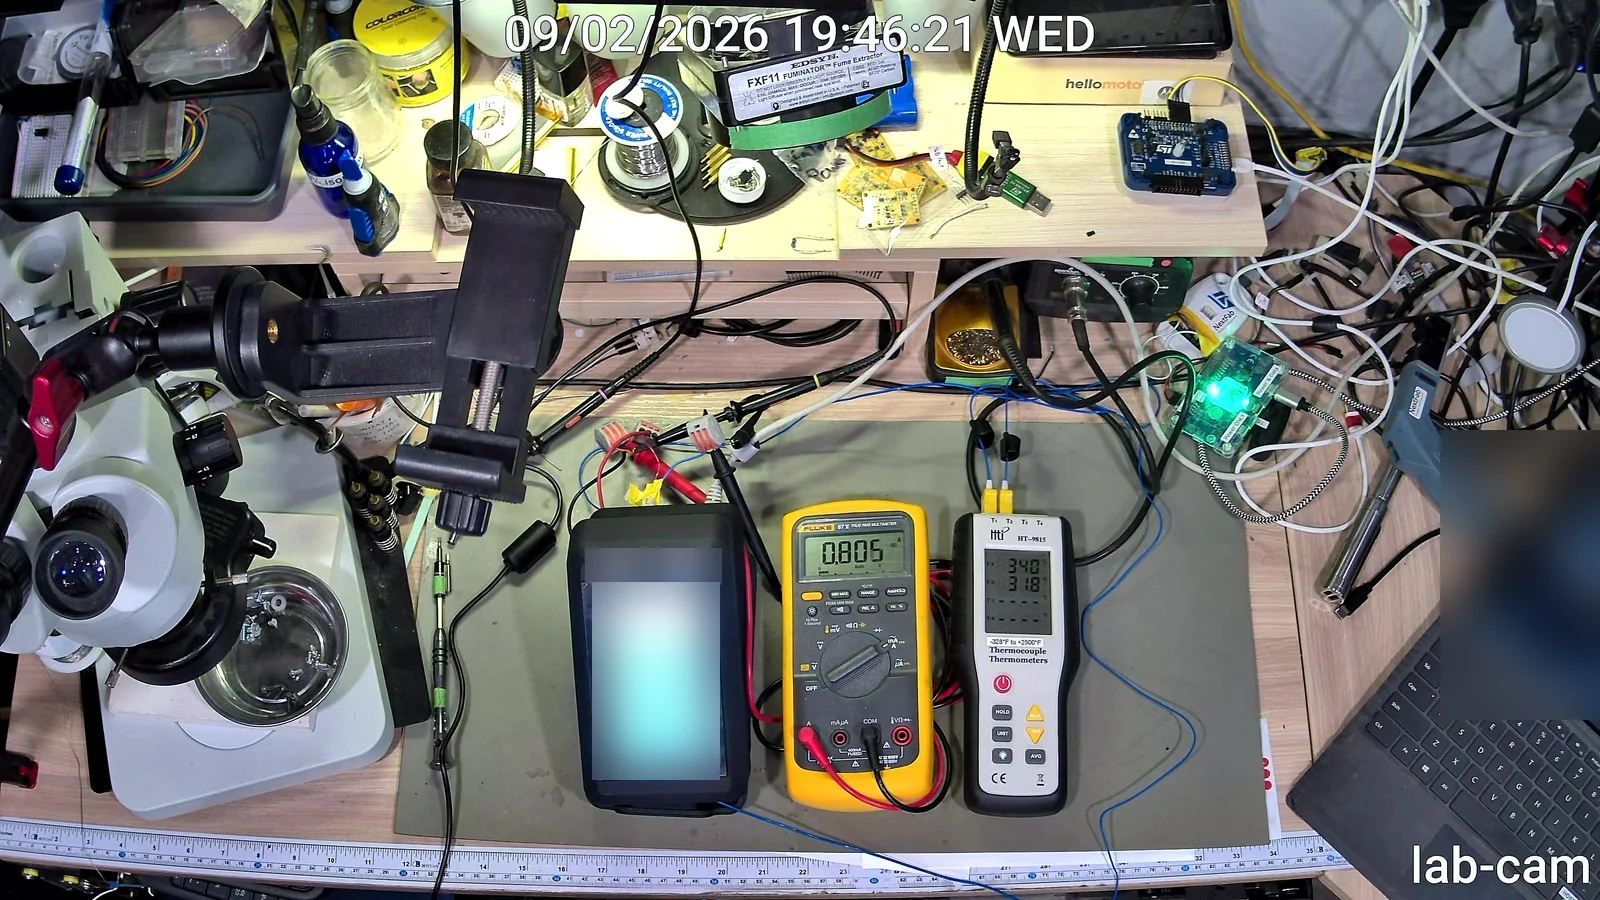
- Ran an overnight recharge under a watchdog with authority to cut AC power, then a two-unit power and thermal A/B study.
- Bench camera
- Electronic load
- Energy meter
- Shell on the device
- Schematic rule check
Measured result
- Charge fault
- charger set to 7.5 A against an 8 A protection limit→3.85 A, a clean charge to termination
- Power-off draw
- 360 mA→0 mA
- Shutdown time
- 90 s→about 1 s
- Pack capacity
- 9.86 Ah, by reference discharge
- Overnight recharge
- 104 watchdog ticks, zero interventions, zero protection trips
- Bench-load driver
- 19 of 19 methods validated against the instrument
Who did what. The session observed, measured, diagnosed, and documented. A person did the rework.
02 · An energy-harvesting glass demo
The demo that looked broken
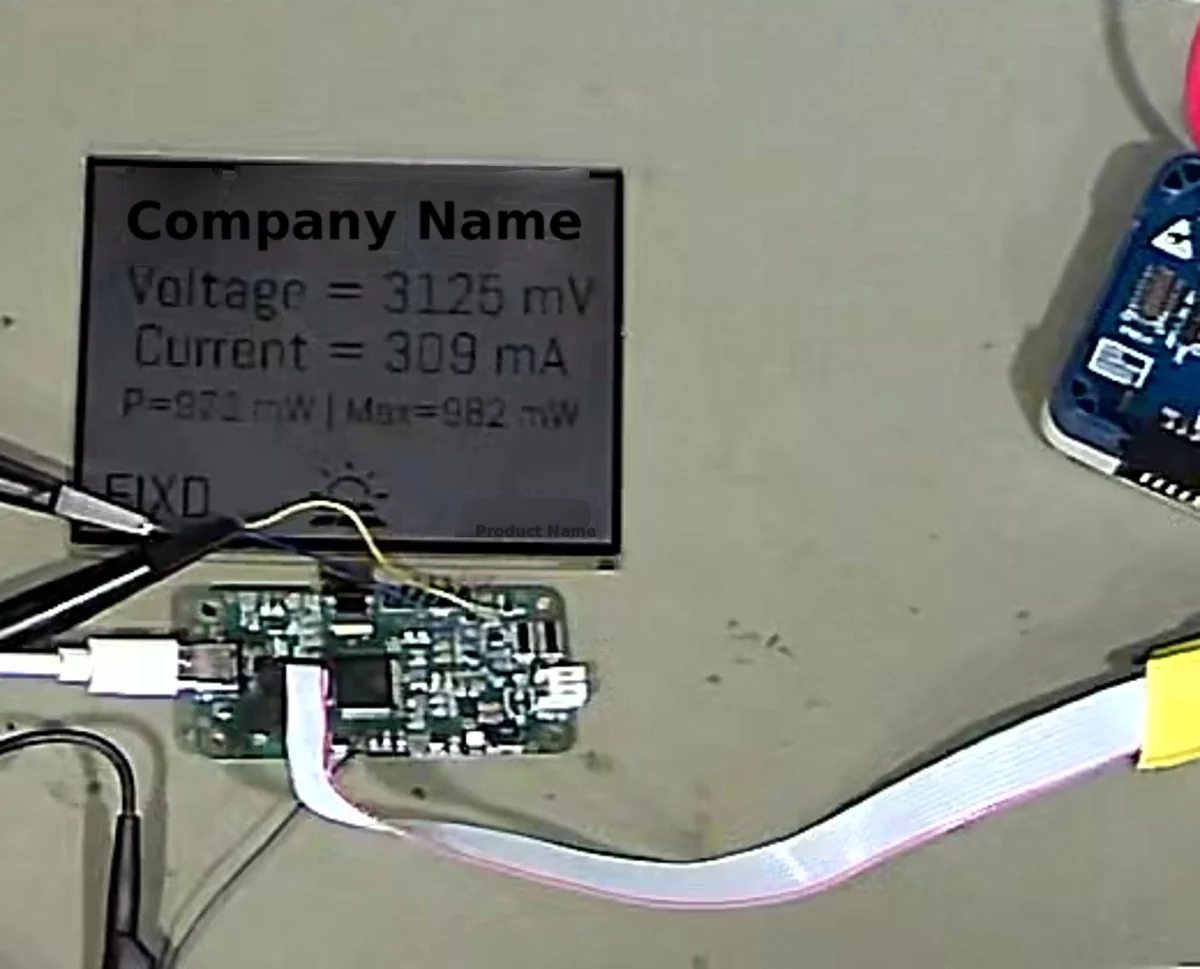
The glass really generated power, but the factory demo's own readout swung so wildly that it looked broken: the on-screen power figure lurched between about 130 mW and 990 mW from second to second, and the demo browned out often.
Swipe sideways to see the whole figure
From the bench
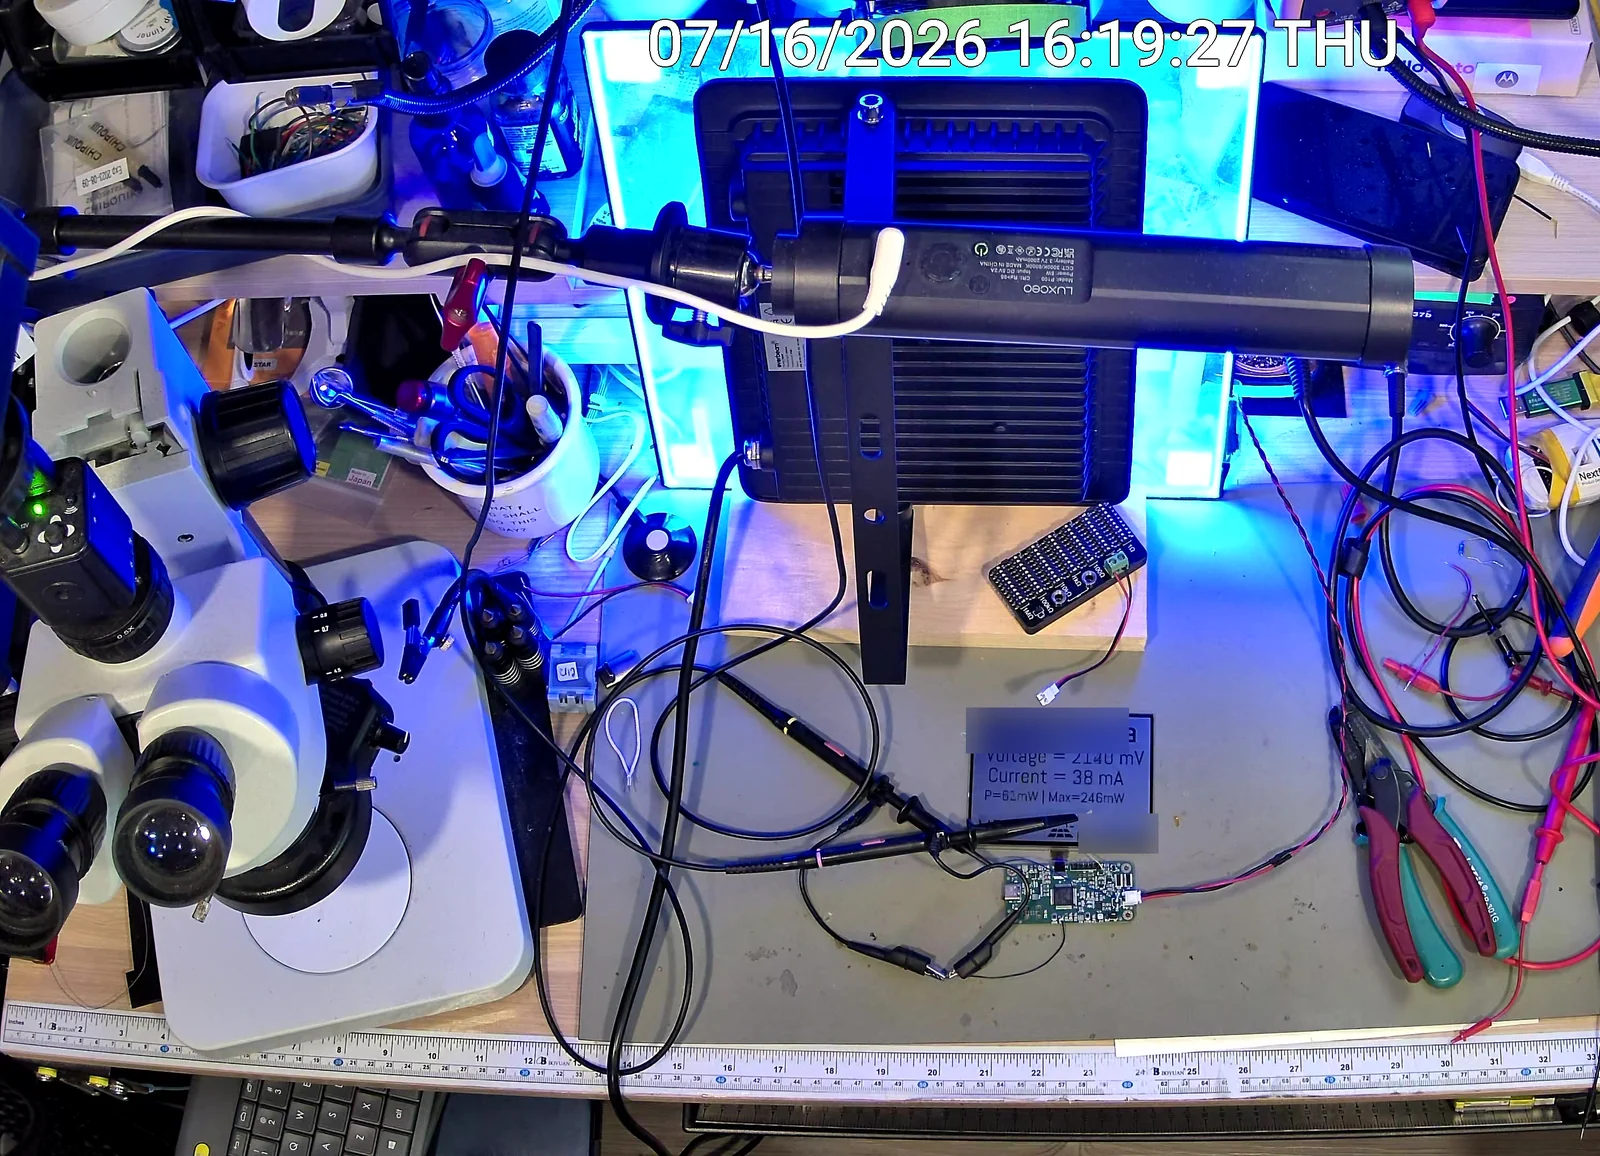
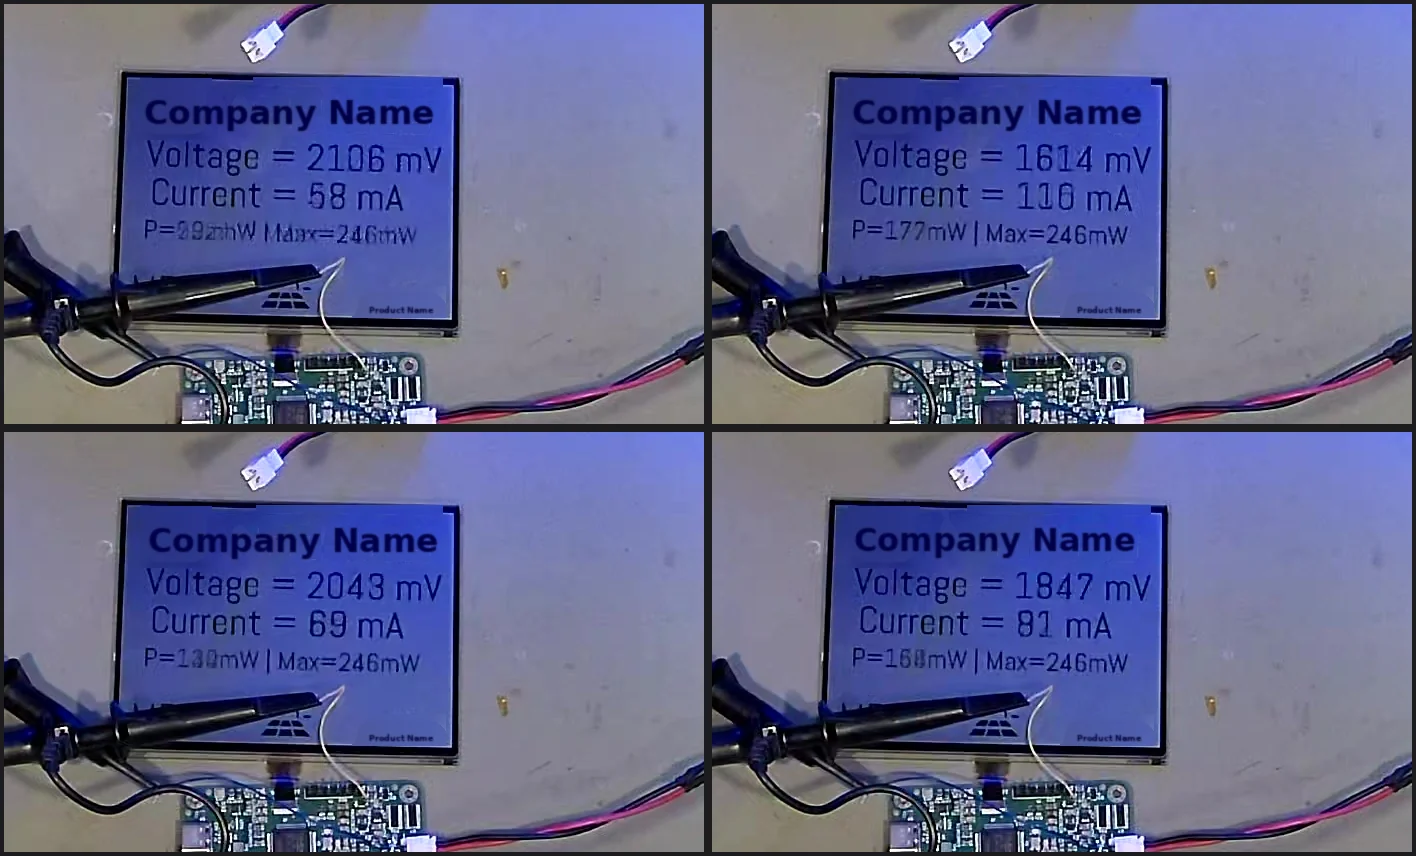
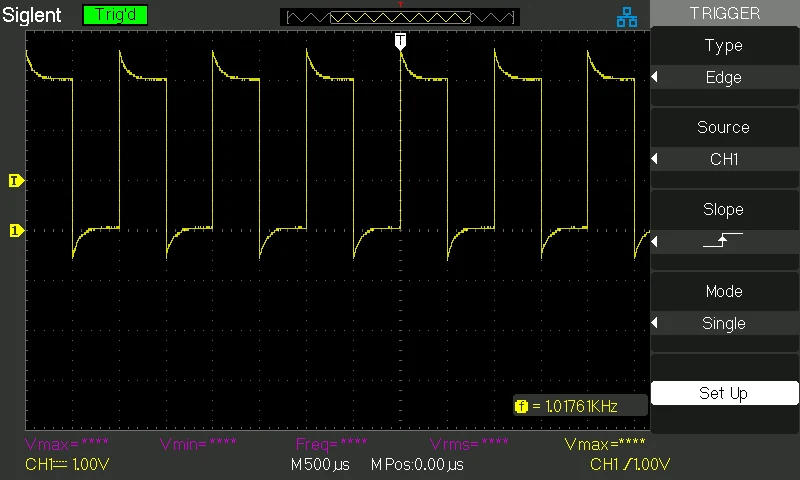
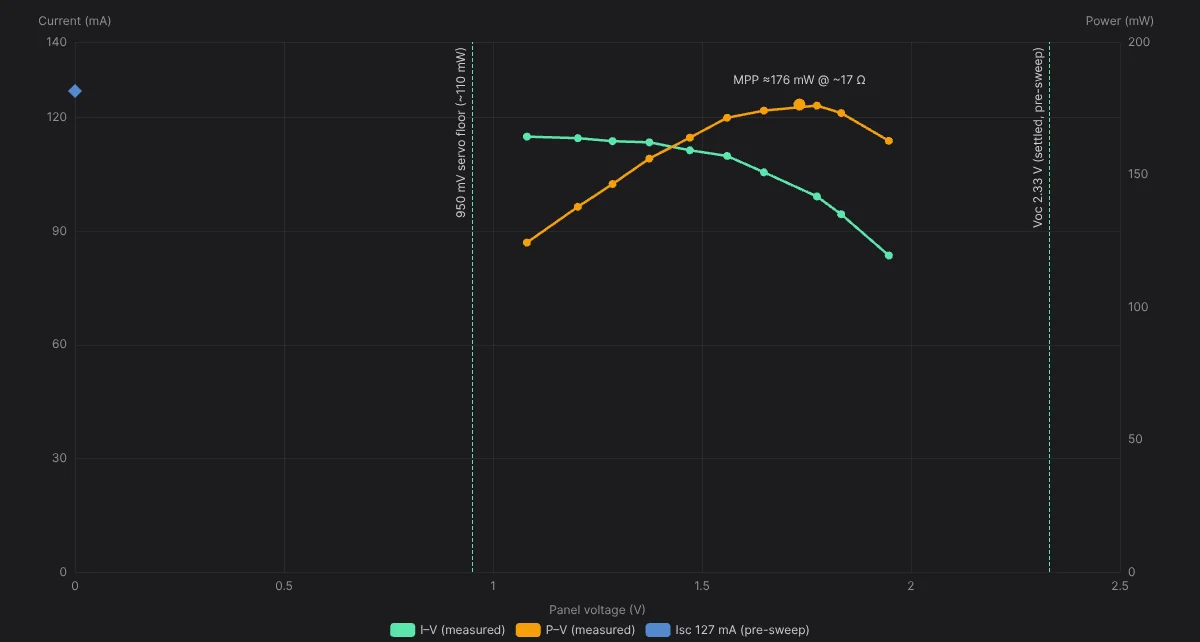
What the session did
- Read the display through the bench camera and caught the swing the client was seeing.
- Drove the oscilloscope over the network and found the cause the display hid: the "maximum power point tracking" was a voltage-floor limit cycle at 0.95 V, pinning the panel far below its best operating point and wasting about 37 to 47 percent.
- Flashed each firmware revision over the debug port and read the raw framebuffer out of RAM, to separate what the firmware drew from what the panel showed.
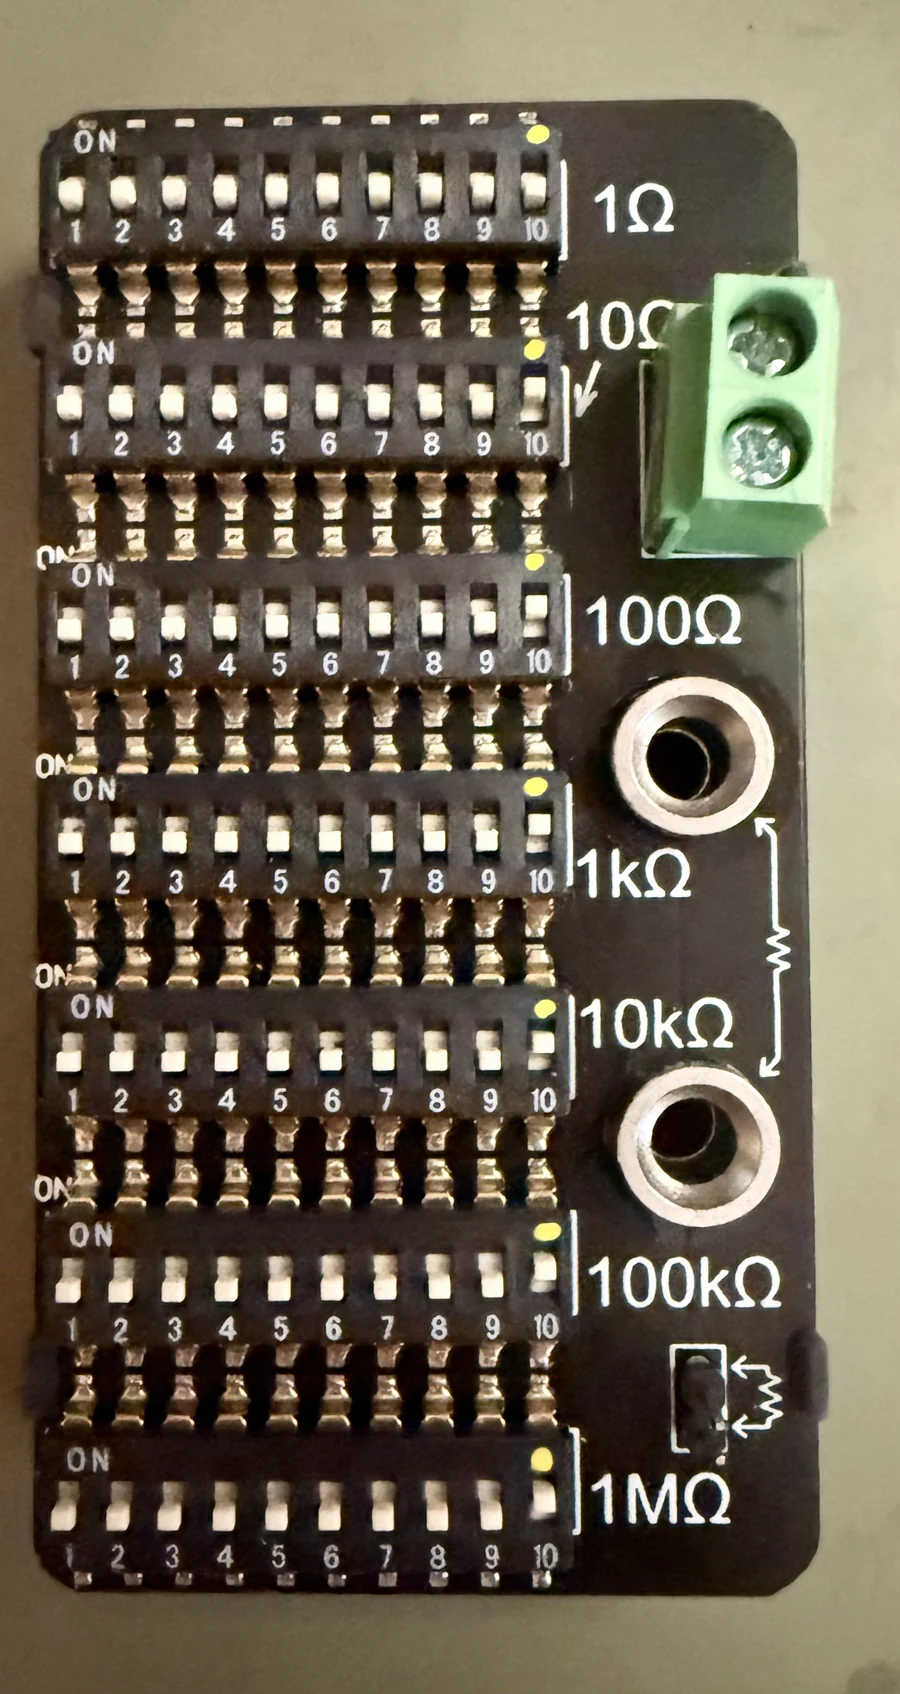
- Measured the panel's true maximum-power point with a decade box, then shipped a fixed-load, filtered, display-synced firmware.
- A later session found a boost-converter latch that never cleared under falling light, specified a two-resistor undervoltage-lockout divider plus matching firmware, and documented the change with photos.
- Bench camera
- Oscilloscope
- Debug probe
- Decade box
Measured result
- On-screen reading
- swing of 130 to 990 mW→±4 % steady
- Brown-outs
- frequent→zero
- Panel operating point
- pinned at the 0.95 V floor→held near the maximum-power point, about 2× delivered power
- Measured maximum-power point
- 176 mW at about 17 Ω
- After the divider
- Rides a falling source down to 25 mA, from 53, and recovers by itself at 45 mA or more (before: never recovered)
Who did what. The session wrote the firmware, flashed it, measured, and merged the fix. A person fitted the divider.
03 · A battery-powered audio device
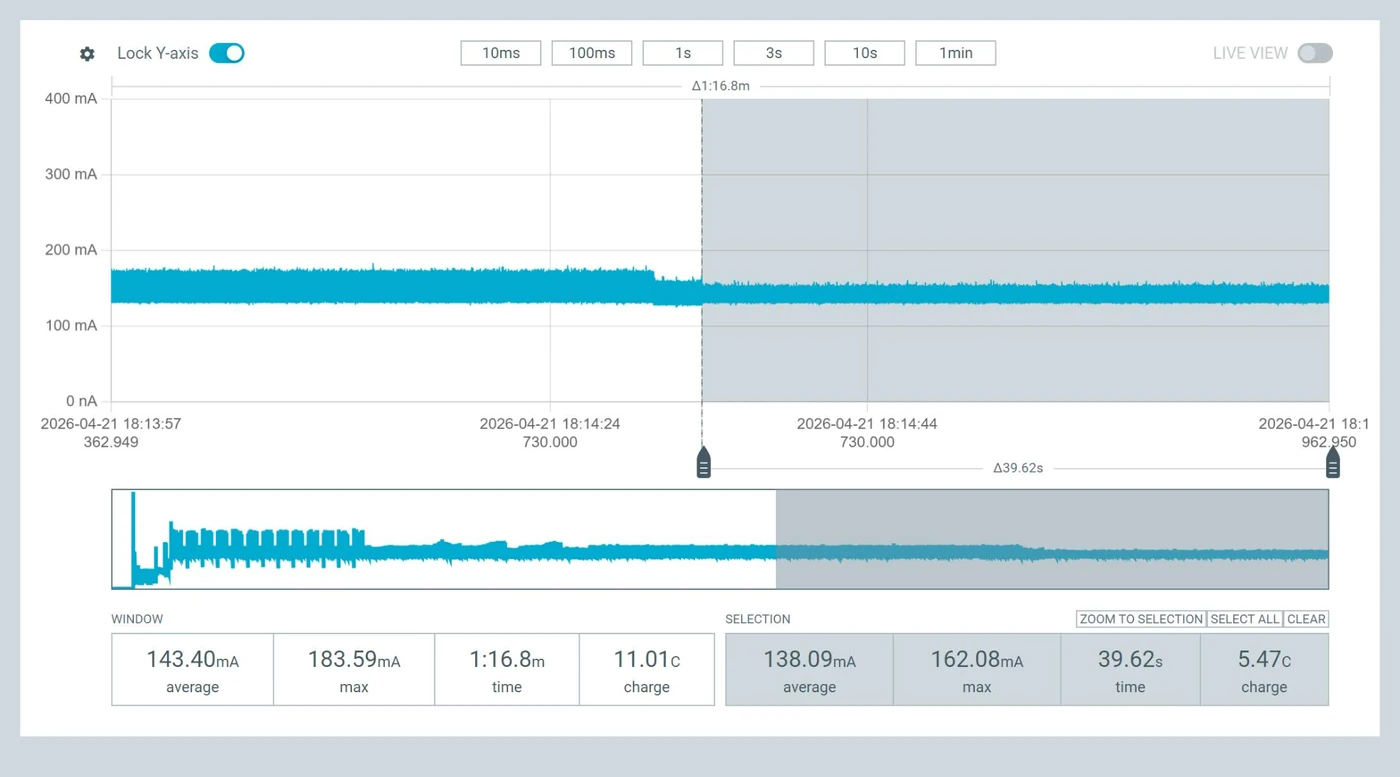
The device that slept at 138 mA
A portable audio device whose idle current, 138 mA, gave it a few days on its battery, with a broken audio library, a heap that fragmented, and a bill of materials over its cost target.
Swipe sideways to see the whole figure
From the bench
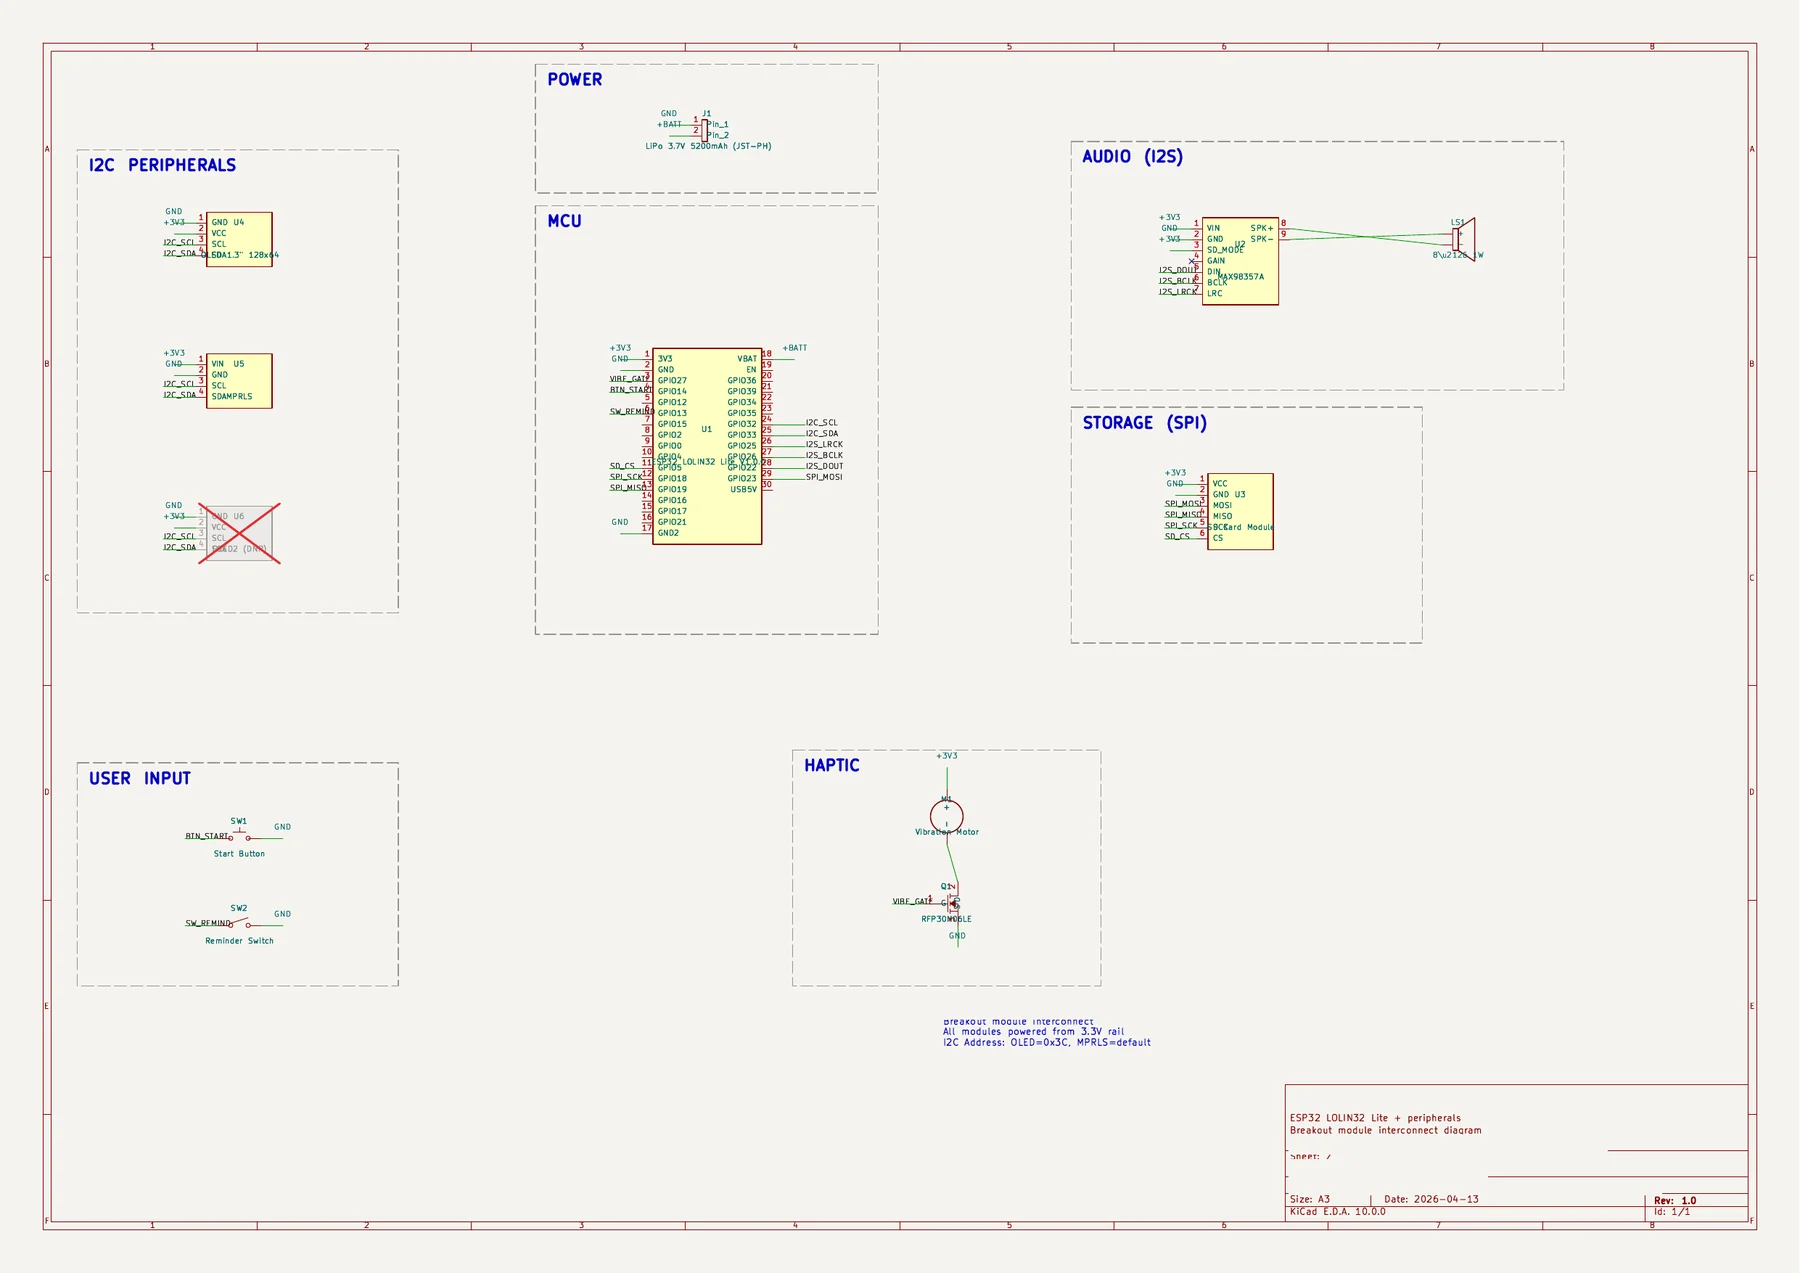
What the session did
- Produced a system wiring schematic in KiCad.
- Replaced the broken audio library with a direct I²S player and fixed the heap-fragmentation failure.
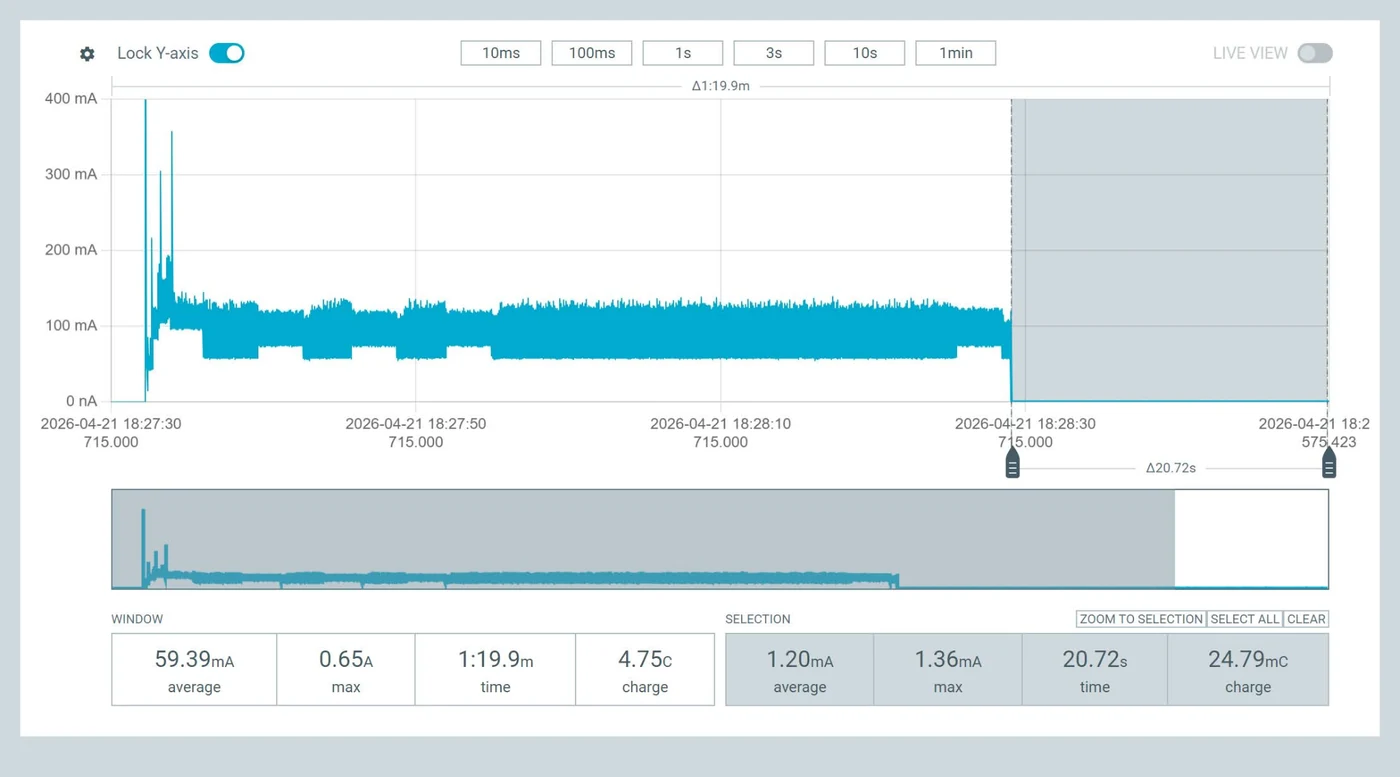
- Wrote deep-sleep firmware with a state-machine controller on a new microcontroller, merged within the week.
- Closed the bill-of-materials cost issue through a board fabrication change and a smaller battery.
- Power profiler
- KiCad
- Debug probe
Measured result
- Sleep current
- 138.09 mA→1.20 mA
- Energy per cycle
- 39.9 mAh→1.5 mAh
- Energy per day
- 959 mAh→36 mAh
- Days on a 5000 mAh cell
- about 5→about 138 (projected from the measured figures)
- Bill of materials
- Cost target met
Who did what. The session wrote the firmware and drew the schematic. A person measured the old and new hardware with the power profiler.
04 · A cellular wearable sensor for livestock
The fuel gauge that said one day
The device was believed to last about a day per charge. Was the drain the recording duty cycle, the radio, or the gauge itself?
Swipe sideways to see the whole figure
From the bench
What the session did
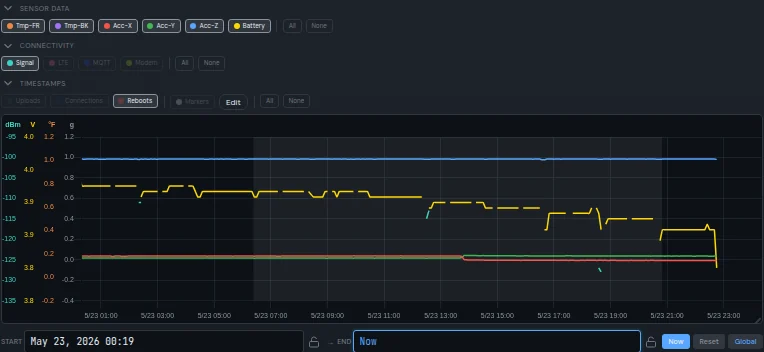
- Ran an isolation study with a power profiler it controlled over SSH: flashed each firmware level, measured with the debugger unplugged (it adds 1 to 2 mA), and compared. All seven duty-cycle levels sat at the same sleep floor, so recording was not the drain.
- Found the gauge 8.8× too pessimistic. The cause was a sleep-current register whose default was 100× the real sleep current. The fix set the lowest available value and moved battery reporting to a voltage-based estimate; the next firmware measured about 0.32 mA on average.
- Ran a fleet test designed to fail. Four of five units dropped out, which exposed a storage trap in poor coverage that silently rebooted one unit about 14 times. Fixed with graduated storage thresholds. The unit in healthy coverage ran 17 days and still had charge.
- Power profiler
- Shell on the profiler host
- Debug probe
Measured result
- Sleep floor
- 0.10 to 0.11 mA at every duty-cycle level
- Average draw
- 6.25 mA implied by the gauge→0.714 mA measured, then about 0.32 mA after the fix
- Gauge register
- 10 mA default→about 0.1 mA real: 100× off
- Days per charge on a 150 mAh cell
- about 1 shown→17 in the field with 27 % left (about 20 projected from the bench)
- Fleet test
- 4 of 5 units failed, by design; one trap found and fixed
Who did what. The session drove the profiler, flashed each level, and fixed the firmware. A person handled the units and the debugger.
About these studies
These are engagements of Solid Product Design, the company behind Hapimatic. Client, product, and person names are withheld, and parts are named by their role. The sessions ran on Hapimatic with the Hardware Bench tools; the bench, the instruments, and the hands belong to our engineers.
Put a session on your bench
The Hardware Bench add-on of the hosted service brings these instruments to your agent. In pilot — contact us